Statement
|
True or False or Can’t Tell
|
Clearly shown on Bar Graph, Pie Graph, Both or Neither
|
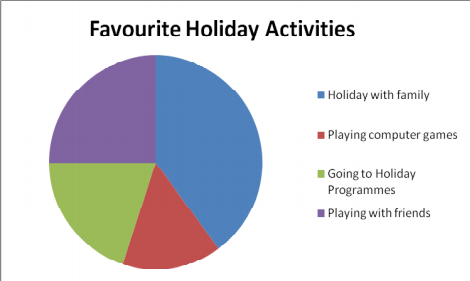
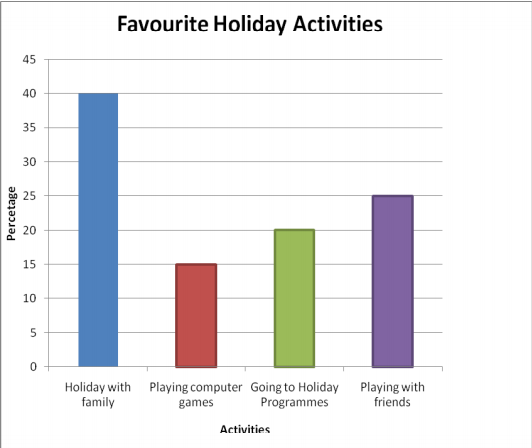
40% said their favourite activity is going on holiday with their family.
|
TRUE
|
Clearly shown on both graph’s
|
Going to holiday programmes was a more popular choice than playing with friends.
|
TRUE
|
Clearly shown on both graph’s
|
A quarter said their favourite activity is playing with friends.
|
TRUE
|
Clearly shown on both graph’s
|
People like to take their friends on family holidays.
|
CAN’T TELL
|
Neither of the graph’s show even thing about people taking their friends on family holidays
|
10% more said their favourite activity is playing with friends than said playing with computers.
|
FALSE
|
Clearly shown on the Bar Graph.
|
Together being on holiday with family and playing with friends makes by more than half the votes.
|
TRUE
|
Clearly shown on the bar graph
|
The most popular activity was going on holiday with family.
|
TRUE
|
Clearly shown on both graph
|
A third said their favourite activity is going to holiday programmes.
|
FALSE
|
Clearly shown on Pie Graph
|
Twice as many people picked going on holiday with their family than picked going to holiday programmes.
|
TRUE
|
Clearly shown on Bar Graph
|